Study Set Content:
A research assistant randomly selected 75 undergraduate students from the list of all students enrolled in the psychology-degree program at a large university. She asked each of the 75 students, “How many minutes per day do you typically spend reading?” The mean reading time in the sample was 89 minutes, and the margin of error for this estimate was 4.28 minutes. Another research assistant intends to replicate the survey and will attempt to get a smaller margin of error. Which of the following samples will most likely result in a smaller margin of error for the estimated mean time students in the psychology-degree program read per day?
Select the Correct Answer:
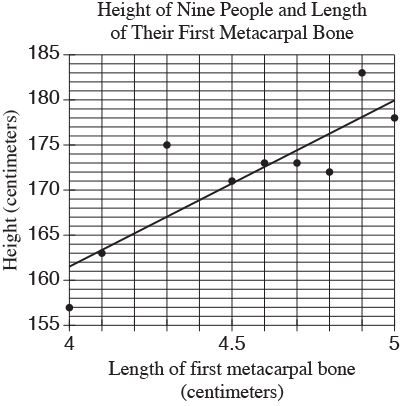
The first metacarpal bone is located in the wrist. The scatterplot below shows the relationship between the length of the first metacarpal bone and height for 9 people. The line of best fit is also shown.
How many of the nine people have an actual height that differs by more than 3 centimeters from the height predicted by the line of best fit?
Select the Correct Answer:
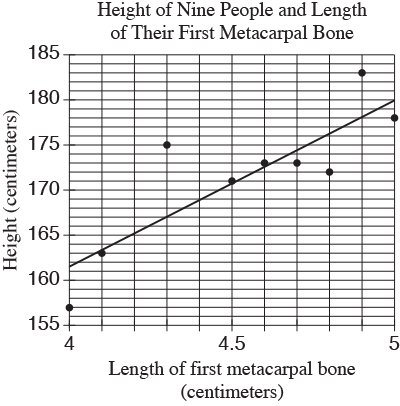
The first metacarpal bone is located in the wrist. The scatterplot below shows the relationship between the length of the first metacarpal bone and height for 9 people. The line of best fit is also shown.
Which of the following is the best interpretation of the slope of the line of best fit in the context of this problem?
Select the Correct Answer:
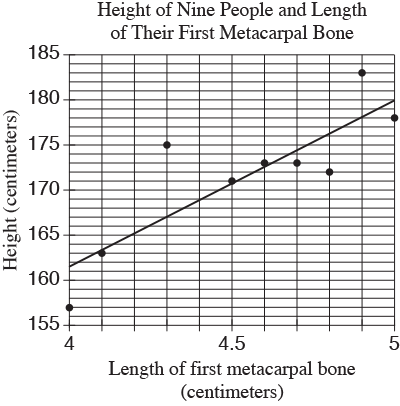
The first metacarpal bone is located in the wrist. The scatterplot below shows the relationship between the length of the first metacarpal bone and height for 9 people. The line of best fit is also shown.
Based on the line of best fit, what is the predicted height for someone with a first metacarpal bone that has a length of 4.45 centimeters?
Select the Correct Answer:
Aaron is staying at a hotel that charges $99.95 per night plus tax for a room. A tax of 8% is applied to the room rate, and an additional onetime untaxed fee of $5.00 is charged by the hotel. Which of the following represents Aaron’s total charge, in dollars, for staying x nights?
Select the Correct Answer:
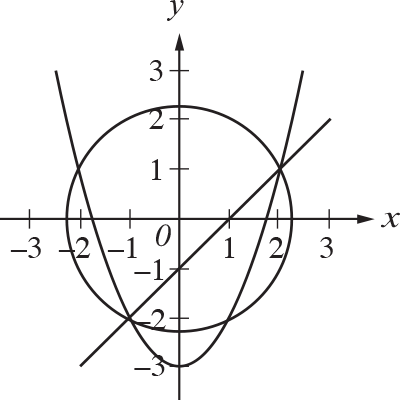
x^2 + y^2 = 5
y = x^2 - 3
x - y = 1
A system of three equations and their graphs in the xy-plane are shown above. How many solutions does the system have?
Select the Correct Answer:
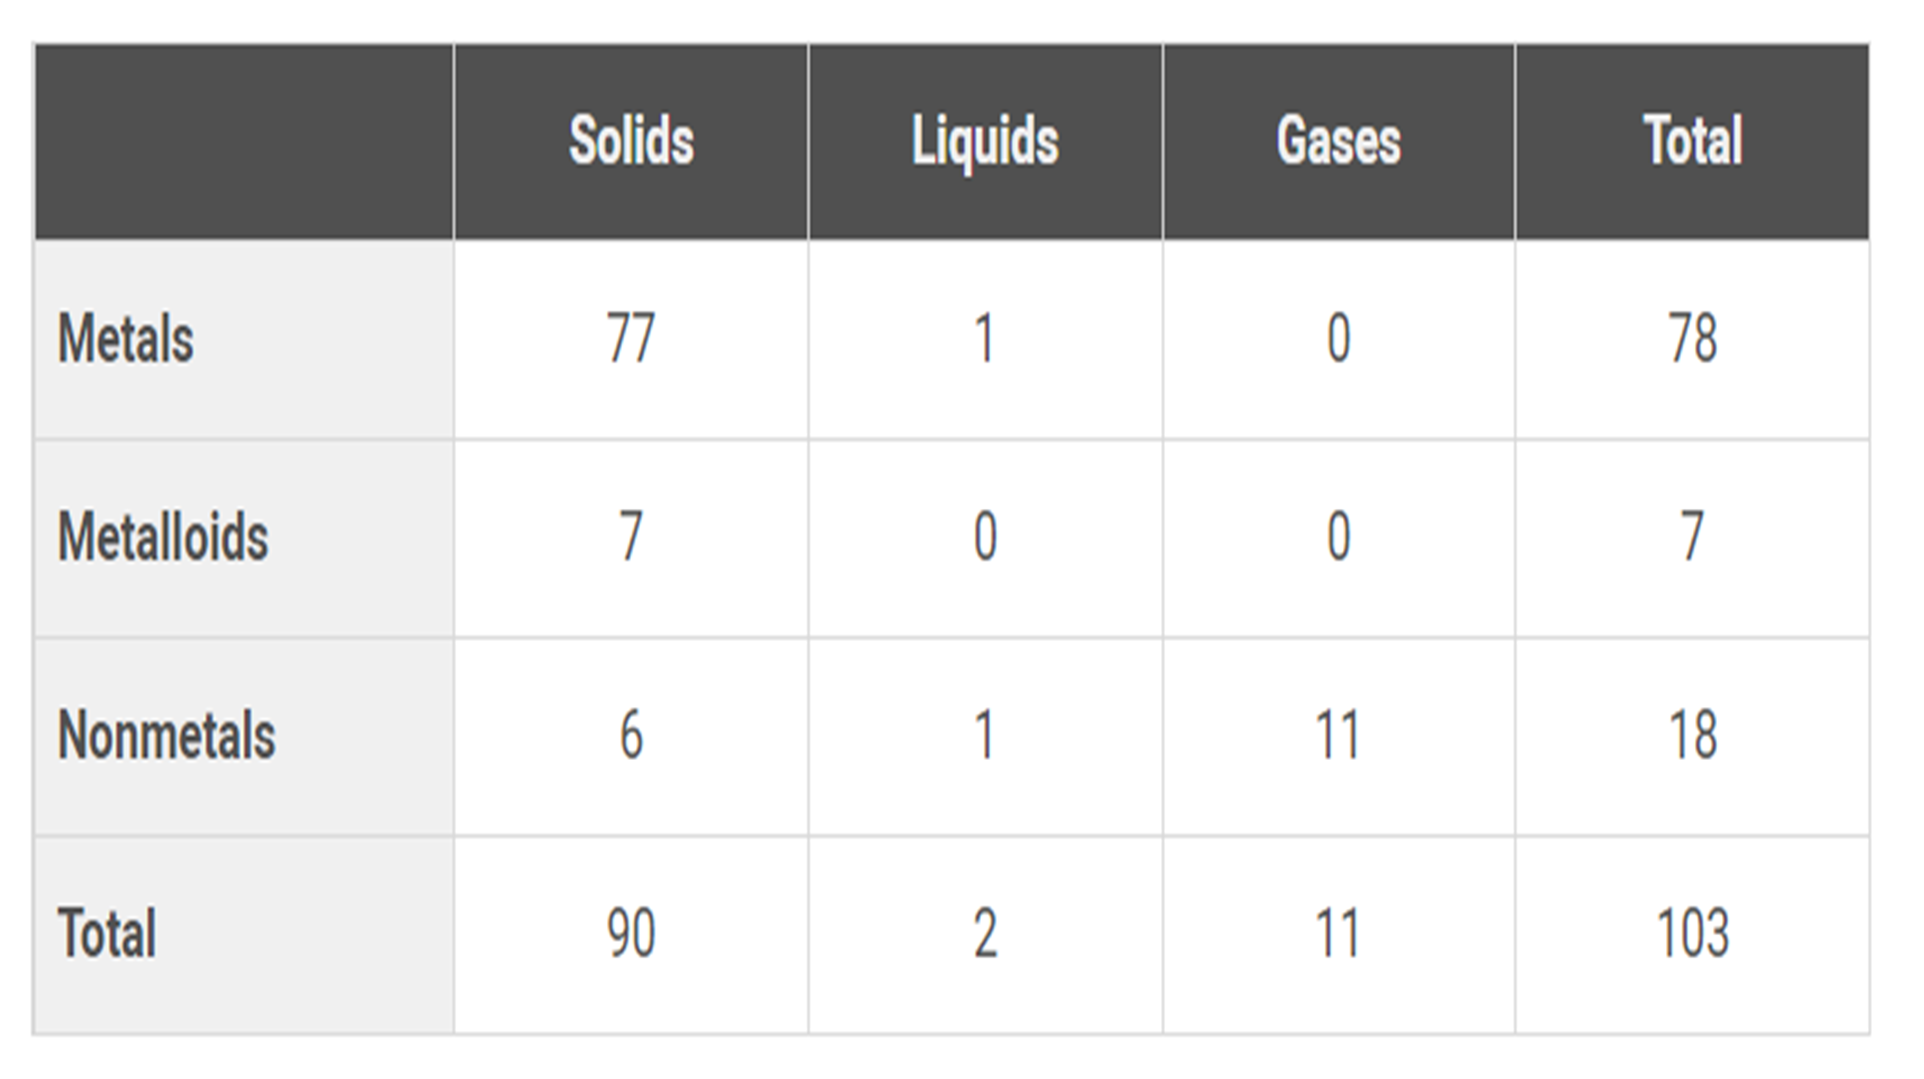
The table below classifies 103 elements as metal, metalloid, or nonmetal and as solid, liquid, or gas at standard temperature and pressure.
What fraction of all solids and liquids in the table are metalloids?
7 / 92
There are 7 metalloids that are solid or liquid, and there are 92 total solids and liquids. Therefore, the fraction of solids and liquids that are metalloids is 7 /92.
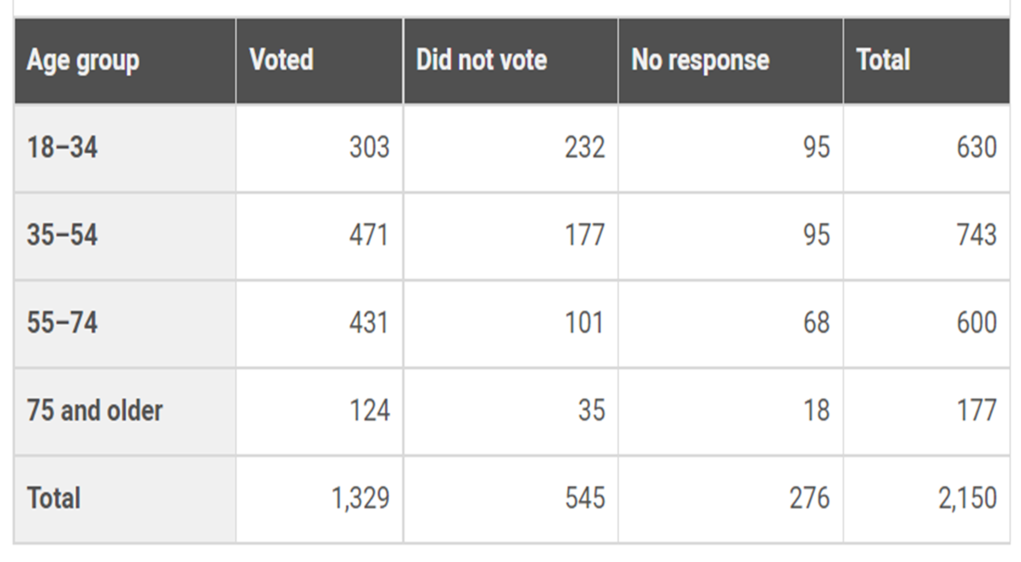
A survey about voter participation in the 2012 US presidential election was conducted among a randomly chosen sample of US citizens. The table summarizes the results by age group.
According to the table, which age group has the greatest percentage of people who reported voting in the 2012 presidential election?
55–74
The question asks you to select the relevant information from the table to compute the percentage of voters for each age group in the table and then compare the percentages to identify the largest one, which is the percentage for the age group in choice C. Of the 600 total people in the 55–74 age group, 431 reported that they had voted, which represents 71.8% of the people in the 55–74 age group. This is the greatest percentage of reported voters from among the four age groups.
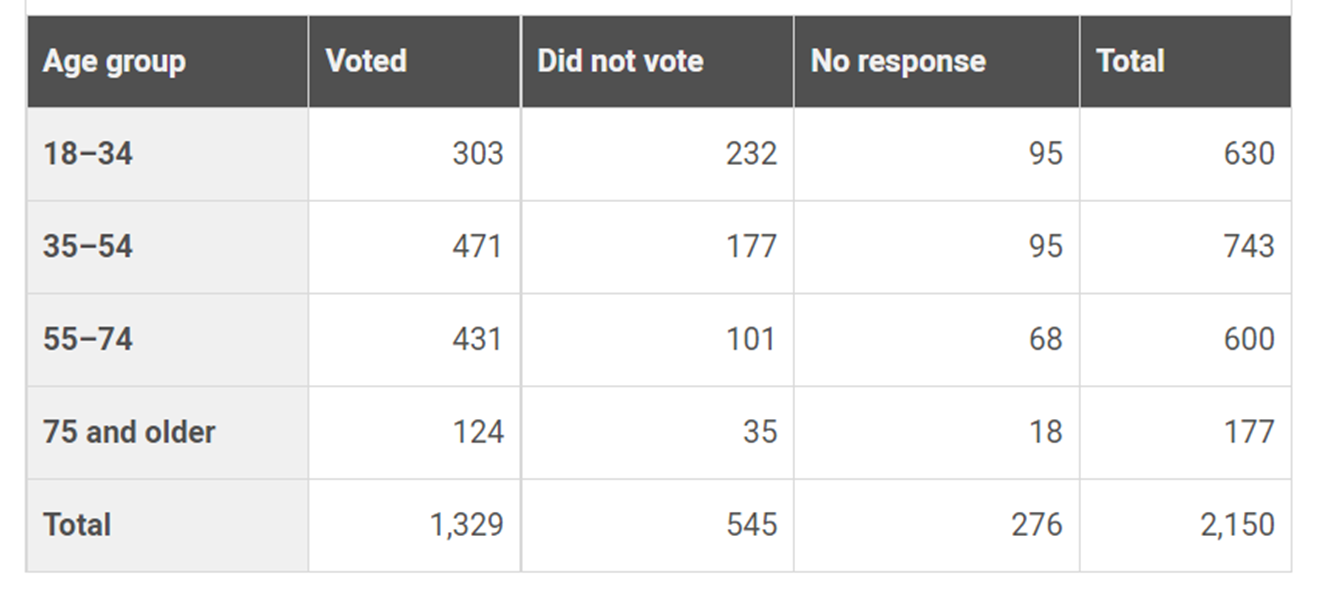
A survey about voter participation in the 2012 US presidential election was conducted among a randomly chosen sample of US citizens. The table summarizes the results by age group.
A second sample of 50 people from the 18–34 age group who reported voting in the 2012 presidential election were selected at random and asked which candidate they voted for. Of these people, 29 responded that they voted for Candidate A, and 21 responded that they voted for someone else. Based on this information, which of the following is the most appropriate estimate of the number of people from the 18–34 age group in the survey who voted for Candidate A in the 2012 presidential election?
176
Choice D is the correct answer. This question asks students to extrapolate from a random sample to estimate the number of survey participants from the 18–34 age group who voted for Candidate A. This is done by multiplying the fraction of people in the random sample who voted for Candidate A by the total number of people in the survey in the 18–34 age group: 29⁄50 × 303 ≈ 176 people.
A company’s manager estimated that the cost C, in dollars, of producing n items is C =7n +350. The company sells each item for $12. The company makes a profit when total income from selling a quantity of items is greater than the total cost of producing that quantity of items. Which of the following inequalities gives all possible values of n for which the manager estimates that the company will make a profit?
Select the Correct Answer:
At a primate reserve, the mean age of all the male primates is 15 years, and the mean age of all female primates is 19 years. Which of the following must be true about the mean age m of the combined group of male and female primates at the primate reserve?
Select the Correct Answer:
A researcher wanted to know if there is an association between exercise and sleep for the population of 16-year-olds in the United States. She obtained survey responses from a random sample of 2000 United States 16-year-olds and found convincing evidence of a positive association between exercise and sleep. Which of the following conclusions is well supported by the data?
Select the Correct Answer:
A biology class at Central High School predicted that a local population of animals will double in size every 12 years. The population at the beginning of 2014 was estimated to be 50 animals. If P represents the population n years after 2014, then which of the following equations represents the class’s model of the population over time?
Select the Correct Answer:
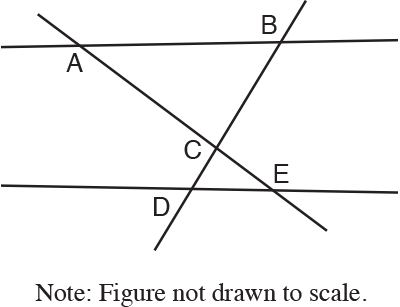
In the figure above, ∆A B C ~ ∆E D C. Which of the following must be true?

Choice C is correct. Given that ∆A B C is similar to ∆E D C, students can determine that the corresponding angle BAC is congruent to angle CED. The converse of the alternate interior angle theorem tells us that AB II DE
The gas mileage for Peter’s car is 21 miles per gallon when the car travels at an average speed of 50 miles per hour. The car’s gas tank has 17 gallons of gas at the beginning of a trip. If Peter’s car travels at an average speed of 50 miles per hour, which of the following functions f models the number of gallons of gas remaining in the tank t hours after the trip begins?
Select the Correct Answer:
The toll rates for crossing a bridge are $6.50 for a car and $10 for a truck. During a two-hour period, a total of 187 cars and trucks crossed the bridge, and the total collected in tolls was $1,338. Solving which of the following systems of equations yields the number of cars, x, and the number of trucks, y, that crossed the bridge during the two hours?
Select the Correct Answer:
When a scientist dives in salt water to a depth of 9 feet below the surface, the pressure due to the atmosphere and surrounding water is 18.7 pounds per square inch. As the scientist descends, the pressure increases linearly. At a depth of 14 feet, the pressure is 20.9 pounds per square inch. If the pressure increases at a constant rate as the scientist’s depth below the surface increases, which of the following linear models best describes the pressure p in pounds per square inch at a depth of d feet below the surface?
Select the Correct Answer:
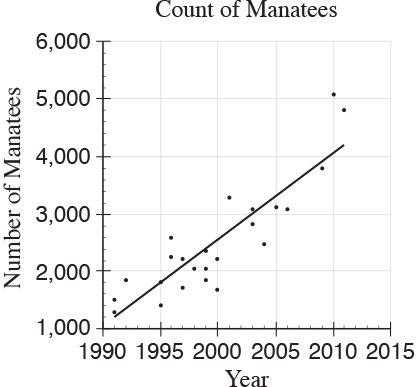
The scatterplot above shows counts of Florida manatees, a type of sea mammal, from 1991 to 2011. Based on the line of best fit to the data shown, which of the following values is closest to the average yearly increase in the number of manatees?
Select the Correct Answer:
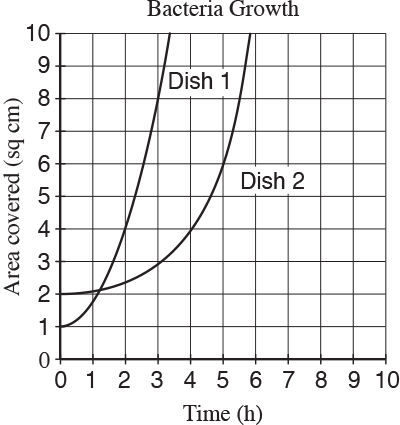
A researcher places two colonies of bacteria into two petri dishes that each have area 10 square centimeters. After the initial placement of the bacteria left parenthesis t space equals space 0 right parenthesis comma the researcher measures and records the area covered by the bacteria in each dish every ten minutes. The data for each dish were fit by a smooth curve, as shown above, where each curve represents the area of a dish covered by bacteria as a function of time, in hours. Which of the following is a correct statement about the data above?
Select the Correct Answer:
A typical image taken of the surface of Mars by a camera is 11.2 gigabits in size. A tracking station on Earth can receive data from the spacecraft at a data rate of 3 megabits per second for a maximum of 11 hours each day. If 1 gigabit equals 1,024 megabits, what is the maximum number of typical images that the tracking station could receive from the camera each day?
